Back to graph gallery
plotpc help page
Code
library(plotpc)
library(alr3) # get banknote data
data(banknote)
x <- banknote[,4:5] # select Top and Bottom
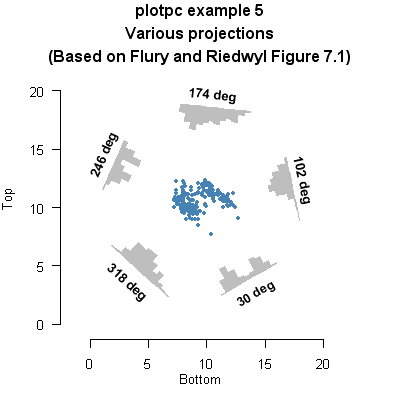
plotpc(x, xrange=24,
main="plotpc example 5\nVarious projections\n(Based on Flury and Riedwyl Figure 7.1)",
height=-2, # reverse directions of histograms to match Flury and Riedwyl
gp.points=gpar(col="steelblue", cex=.5),
breaks=12, heightx=0, heighty=0, height1=0, height2=0,
axis.len1=0, axis.len2=0,
angle3=30, angle4=102, angle5=174, angle6=246, angle7=318)
Back to graph gallery