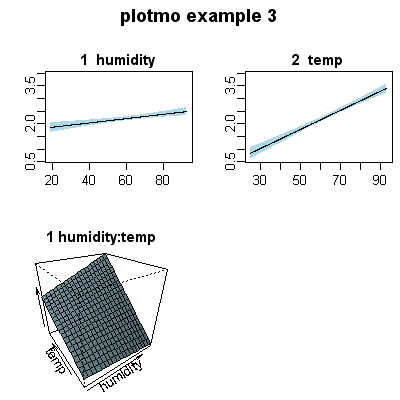
library(earth)
data(ozone1)
plotmo(lm(log(O3) ~ humidity*temp, data=ozone1),
       caption="plotmo example 3", level=.99, clip=FALSE)