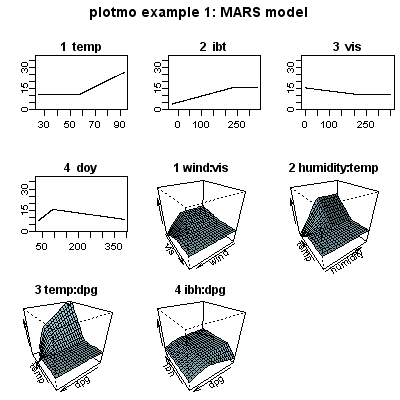
library(earth)
data(ozone1)
a <- earth(O3 ~ ., data=ozone1, degree=2)
plotmo(a, caption="plotmo example 1: MARS model")