library(earth)
data(etitanic)
# we use an earth model here, but plotd works with any model
fit <- earth(survived ~ ., data=etitanic, degree=2, glm=list(family=binomial))
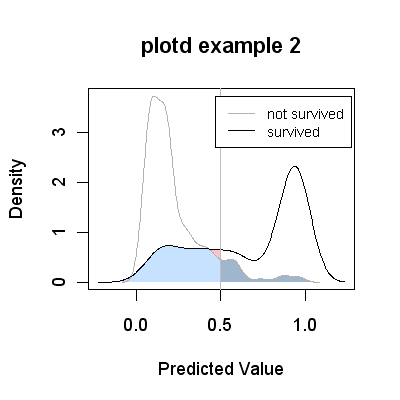
plotd(fit, main="plotd example 2", type="response", vline.col="gray",
err.col=c("slategray1","slategray3","pink"))